Southern Machinery provides professional SMT peripheral equipment

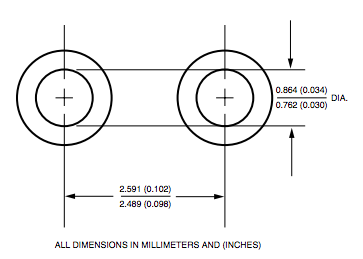
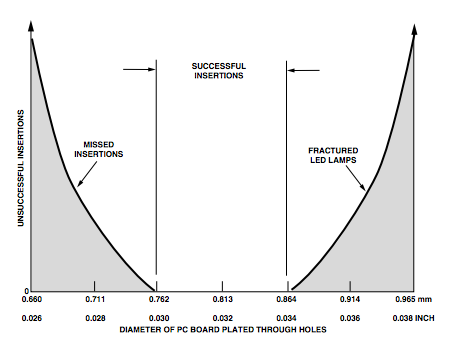
PCB hole considering for Auto Insertion
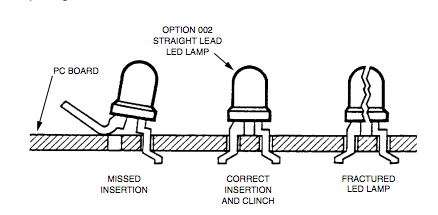
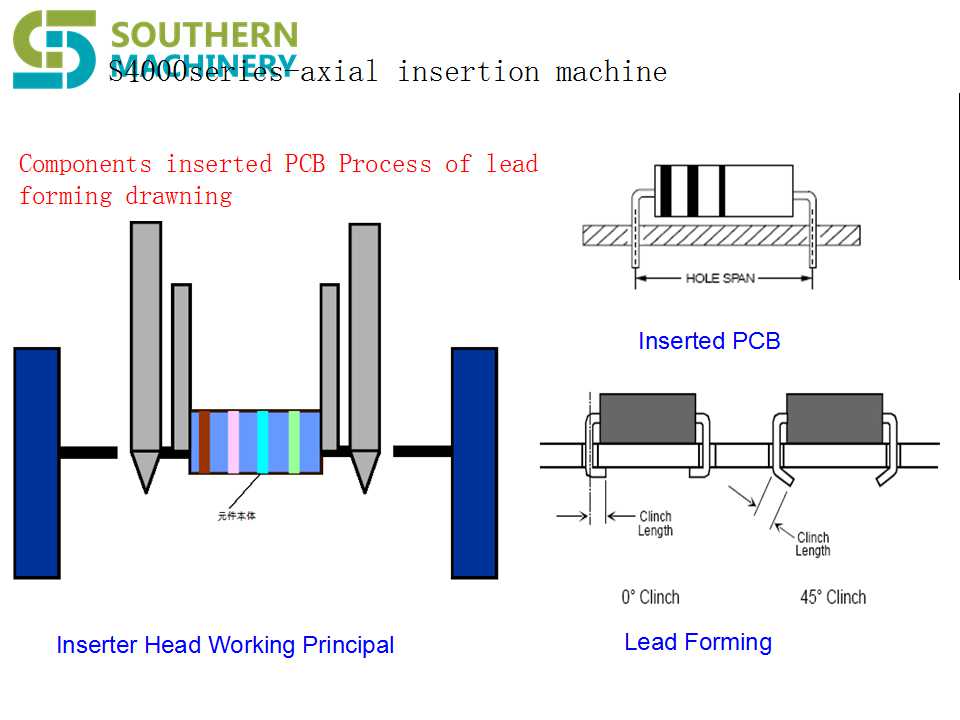
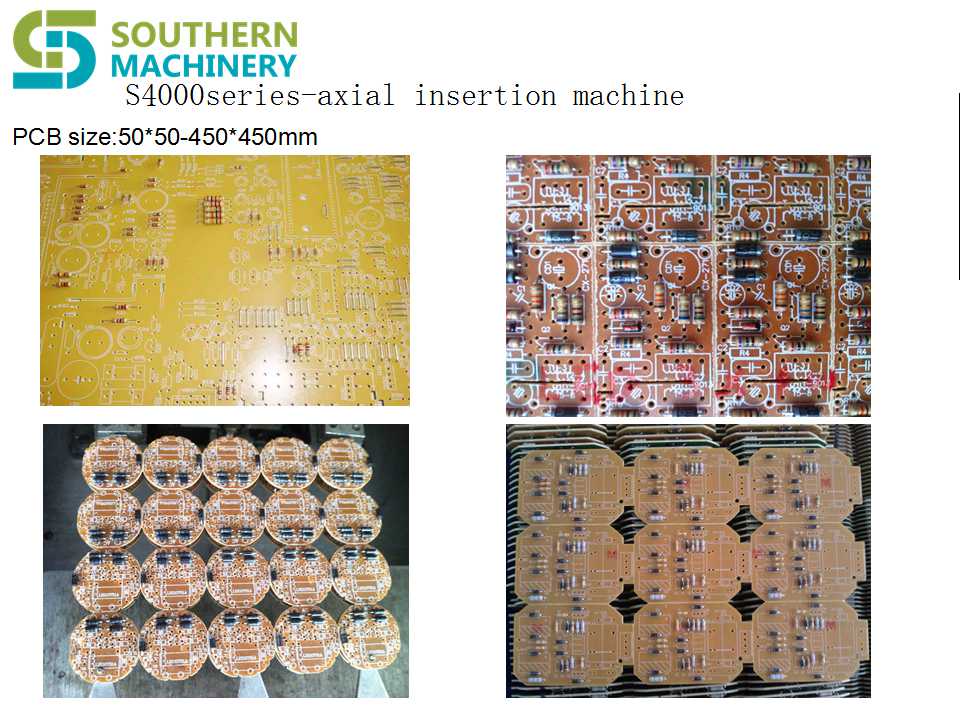
These through hole components may be auto-inserted into printed circuit boards with most axial or radial auto-insertion equipment. However, it is important to have the proper plated through hole size and spacing in the printed circuit board to assure high insertion yields. This application brief details specific information on the printed circuit board plated through hole size, spacing and tolerances necessary to assure high insertion yields.
LED insertion machine
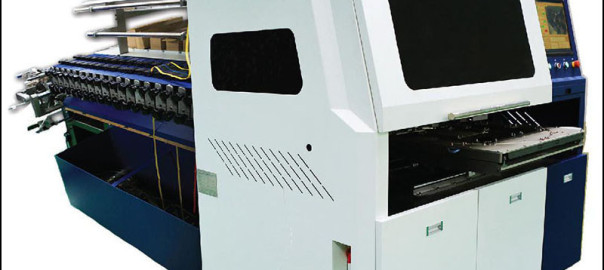
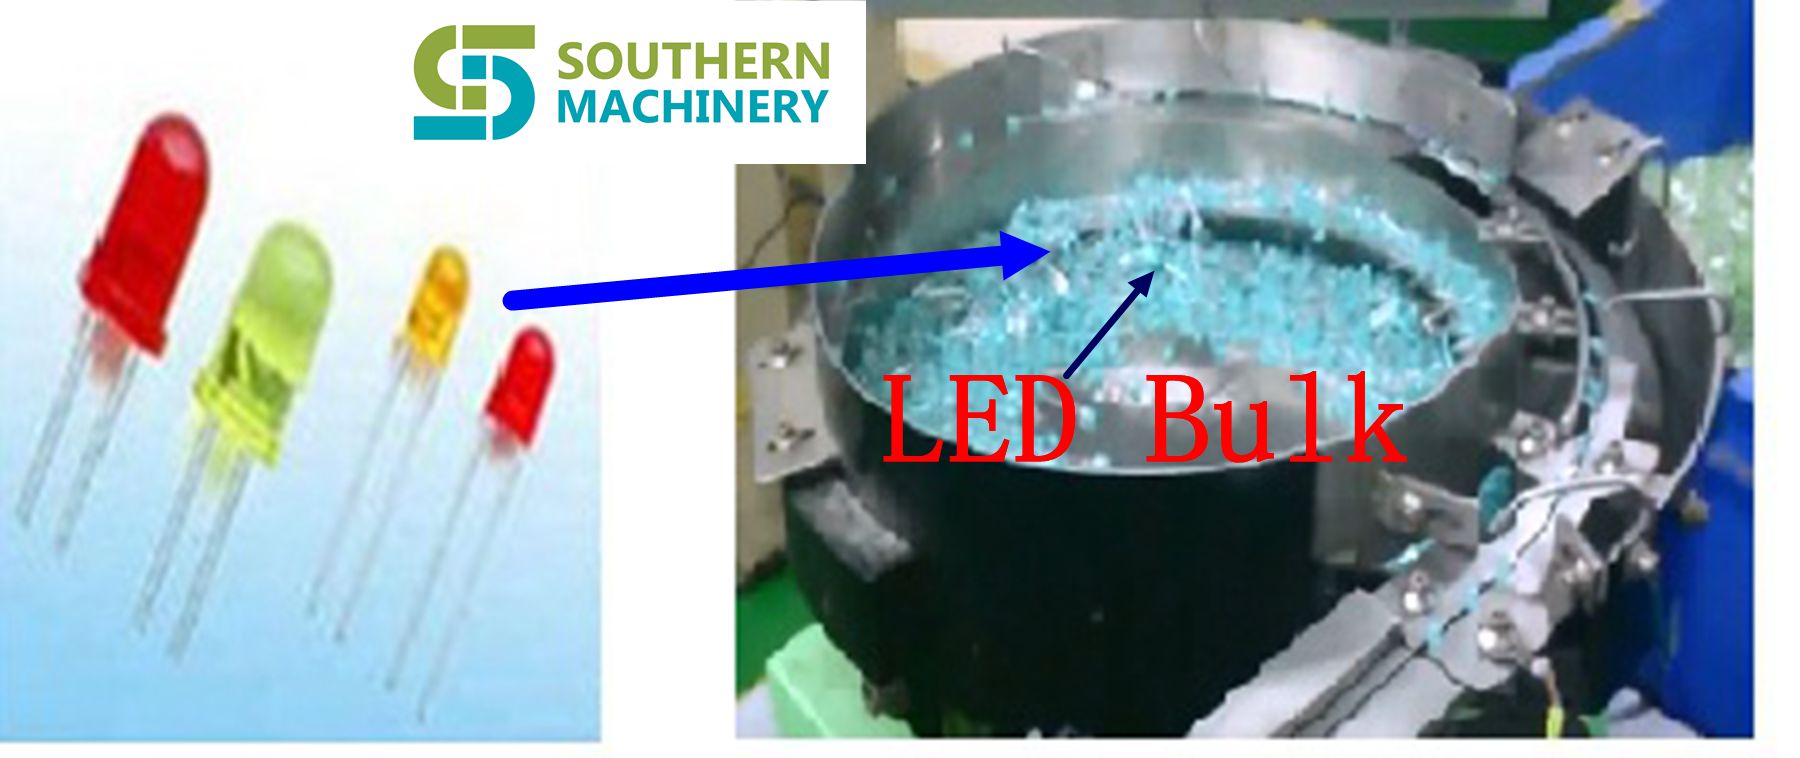
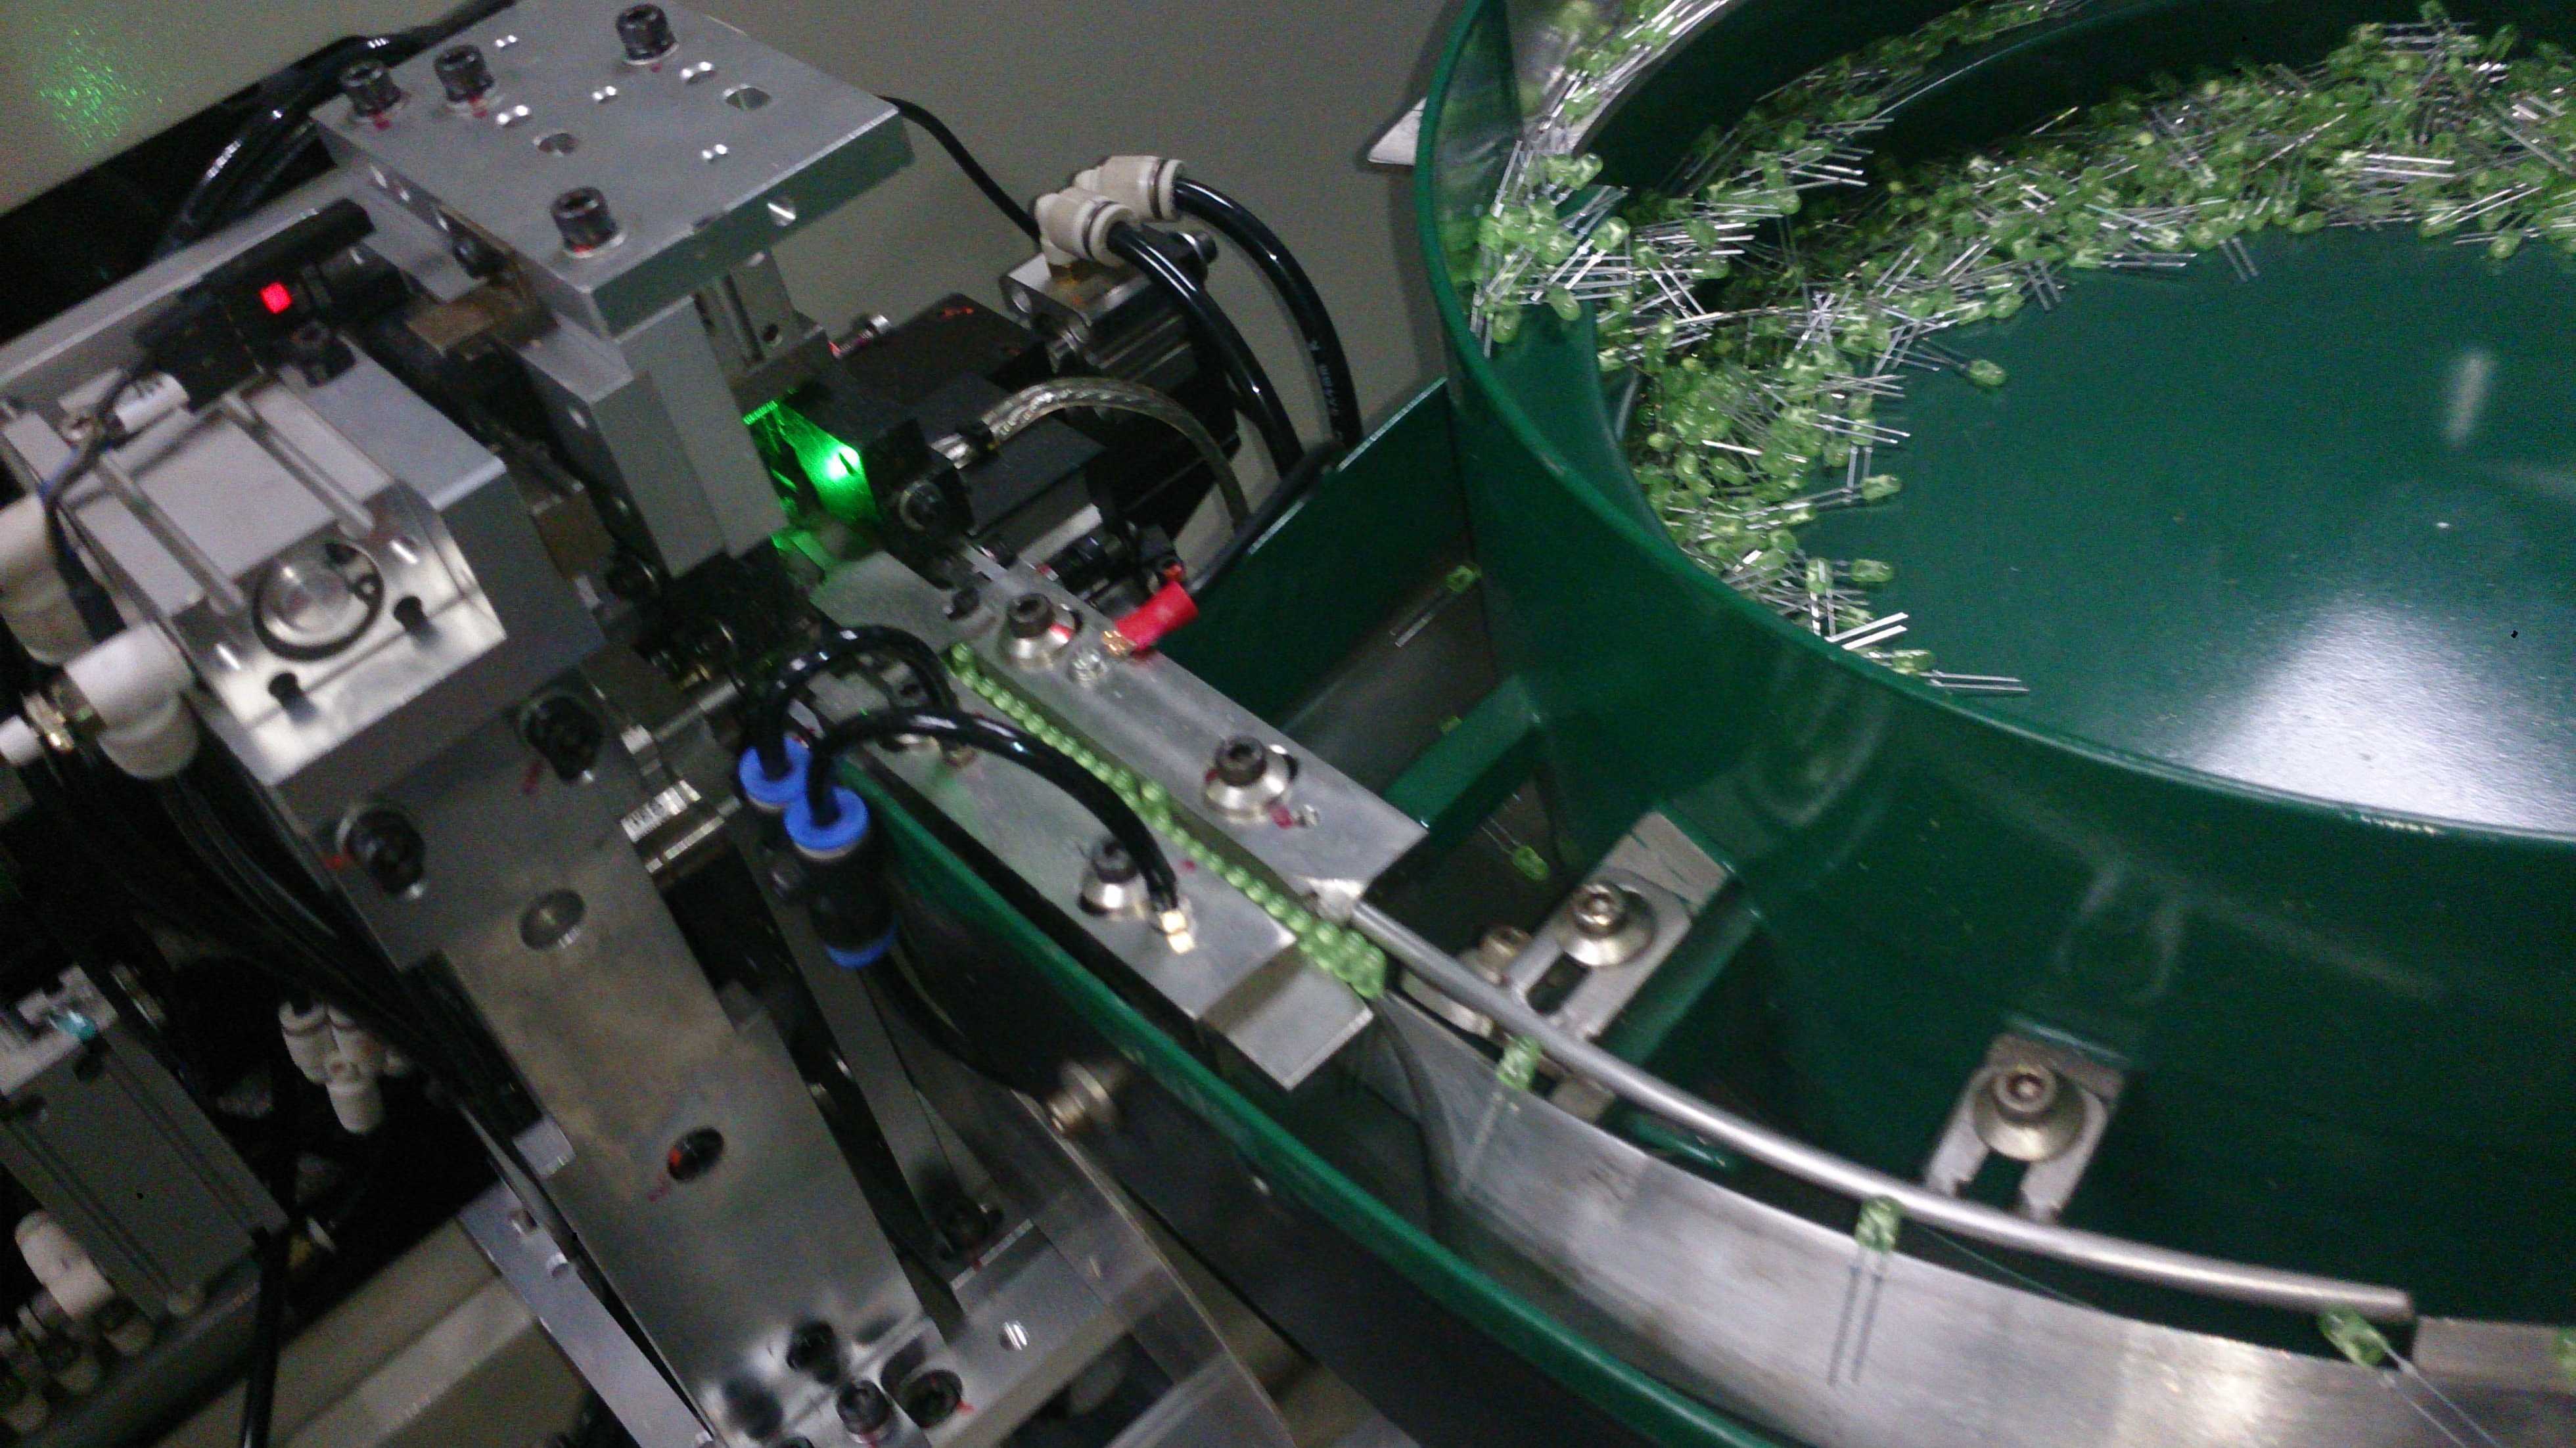
High-speed LED Insertion – S3000 Radial Insertion machine. Bulk feeder machine on the market for LED
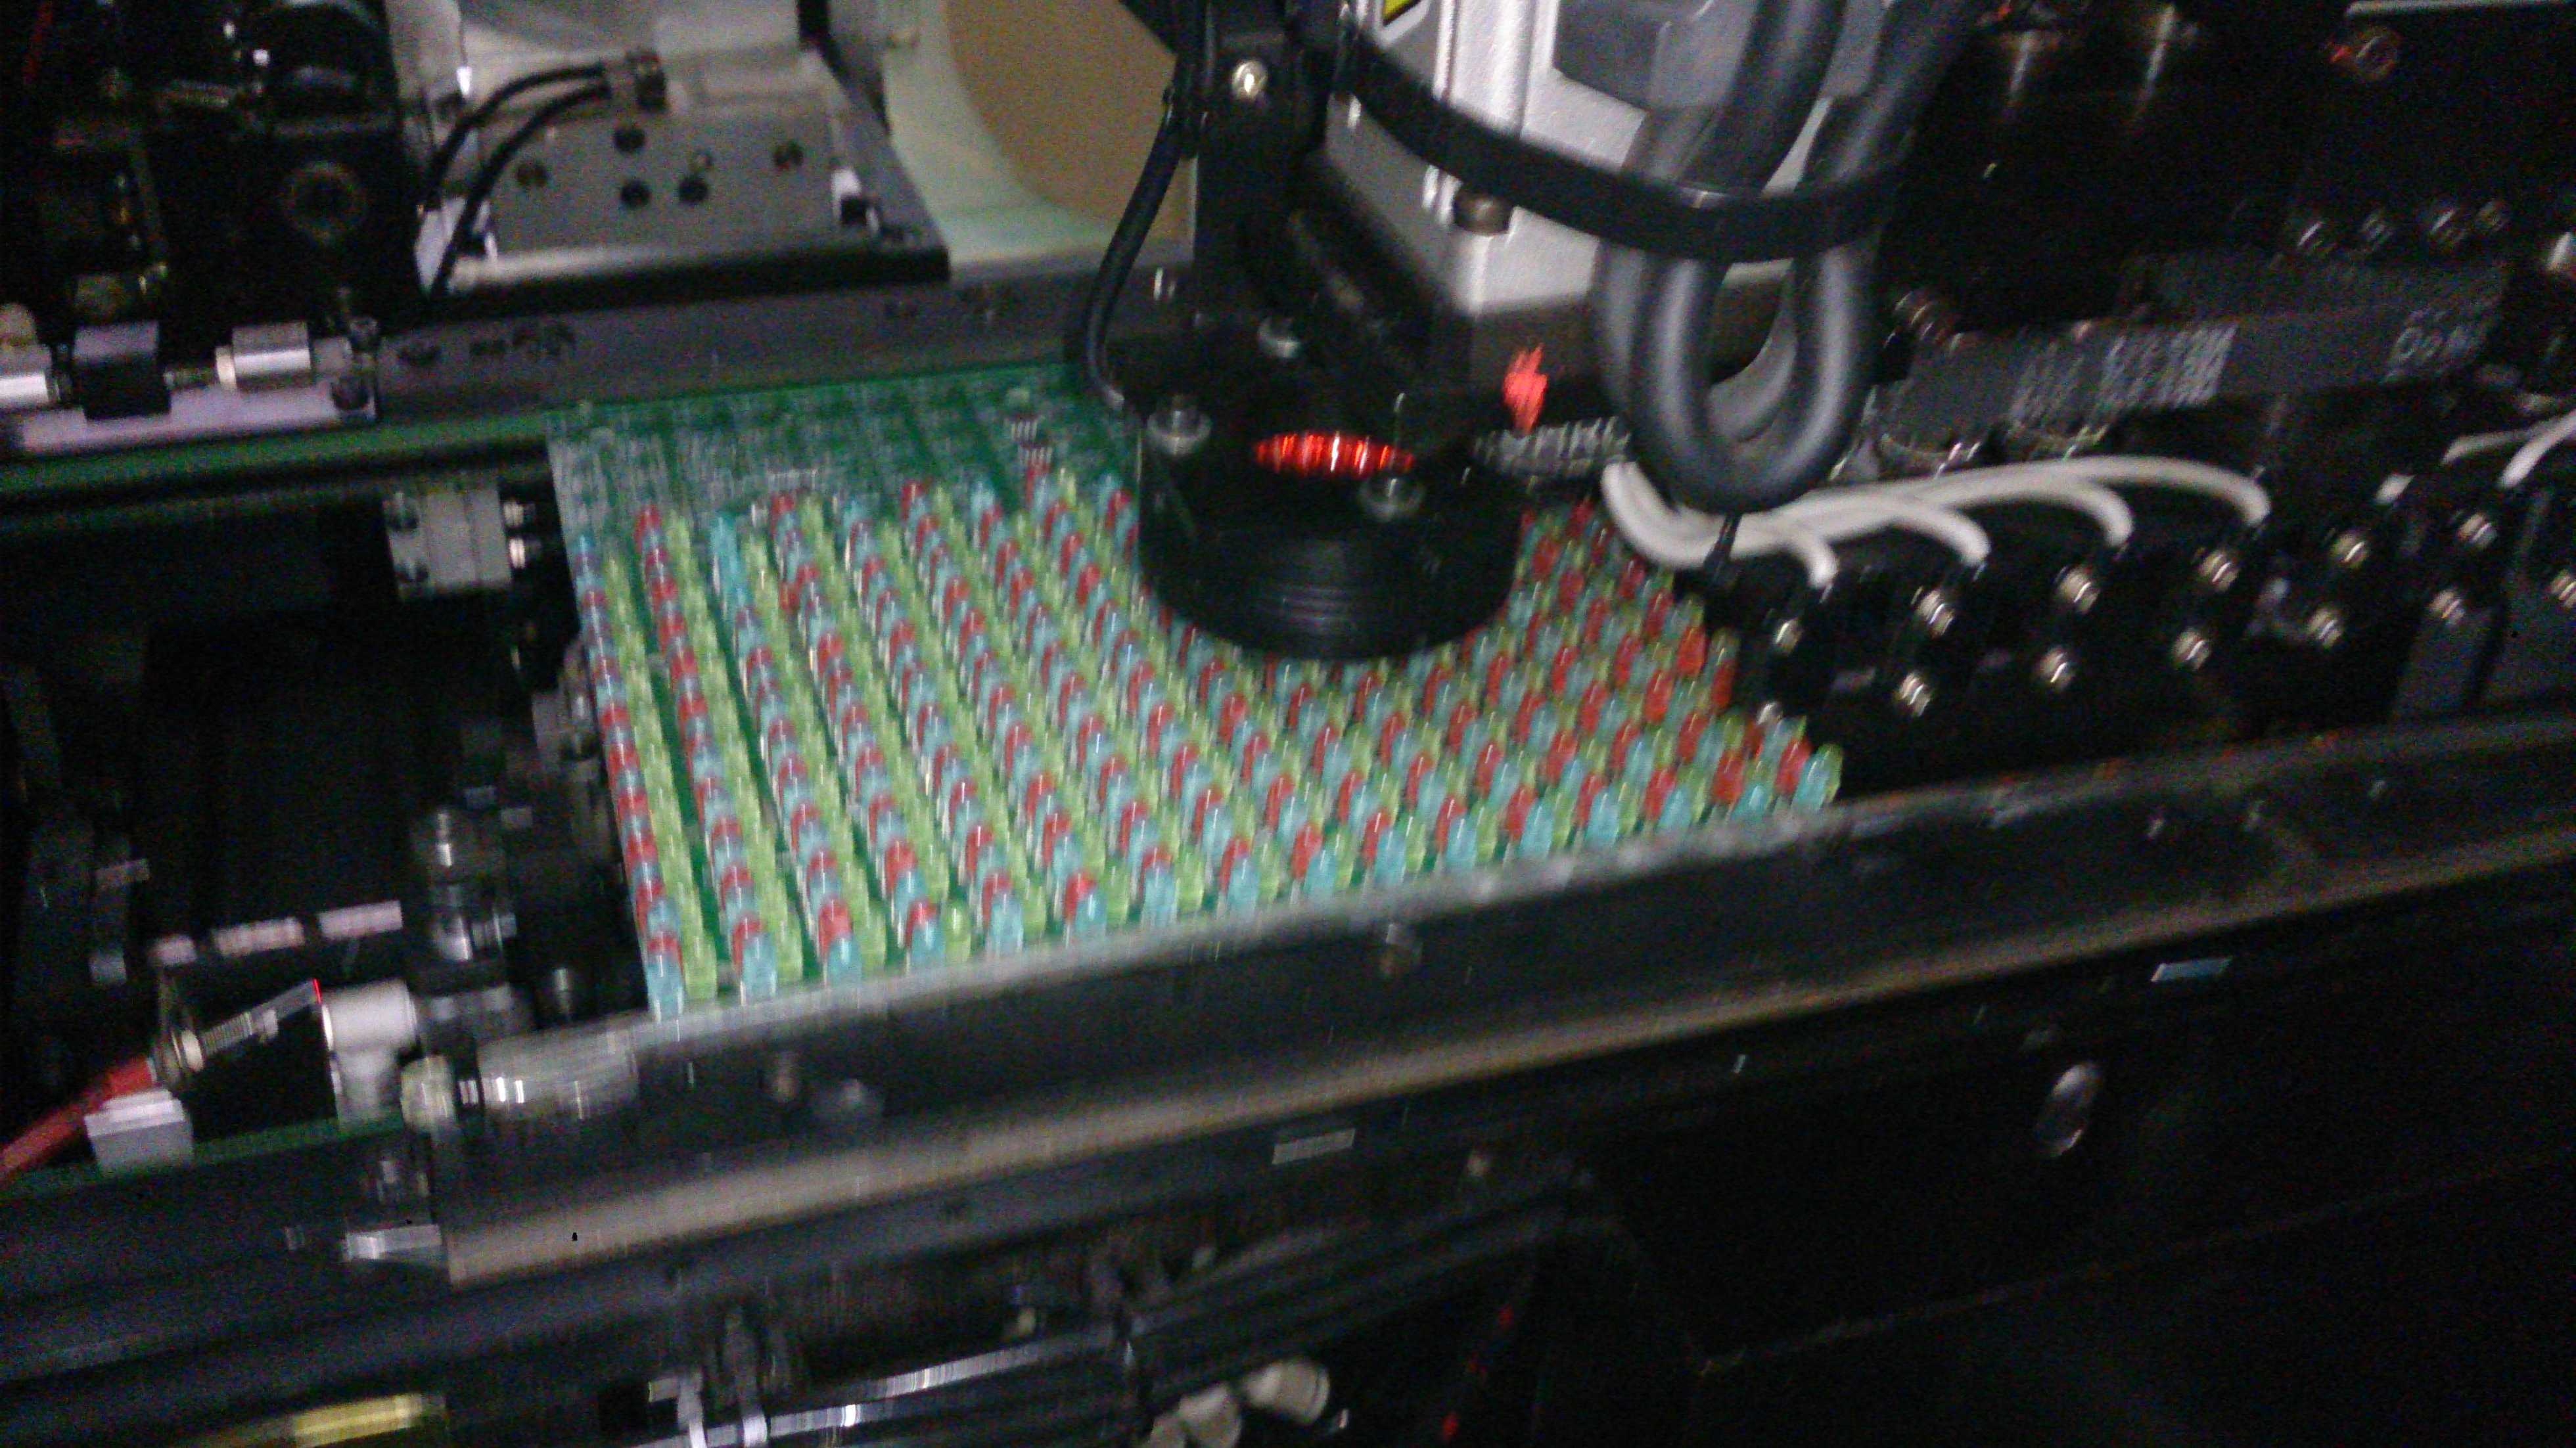
Dedicated 2.5 tooling provides very high density insertion
Large form factor machine for fluorescent tubes (up to 1.2 meter)
Largest inventory of parts http://genericclomid.net available on-line
Low power consumption
Low air consumption – all major sub-systems are servo
Proven platform with stable design
Next SMT factory
Saving your labor cost.
由 Auto Insertion 贴出贴子。



LED Radial Insertion machine : Chain Clip Wear Test Report
Chain Clip Wear Test Report
Introduction
The purpose of this experiment was to determine the wear on three critical to function chain clip dimensions due to three springs of equal free length and different spring constants, and also to analyze the wear effects on functionality. Both dual span and small triple span configurations were included in the test. Thirty dispense heads on the Radial 6380A sustaining machine were modified and used for the test. Each clip was run for 50,000 cycles. Due to the variation in clamping force of the five different configurations tested, some test heads had components replaced more frequently than others, resulting in some test clips seeing more new components than others. The ANOVA analysis (Appendix 2, page 7) shows however that the number of new components presented to the test clips was not statistically significant and therefore not a significant contributor to wear.
Below is an outline of the five configurations tested:
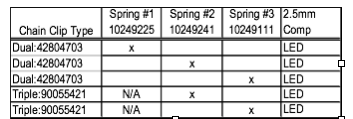
Two chain clip issues drove this experiment: components migrating up and/or down in the clip and concern that heavier springs will accelerate wear.
Upon completion of the test, force and distance measurements were taken using a test fixture and a 2.5mm setup tool.
Setup and Data Collection
Wear Data: See Appendix 1
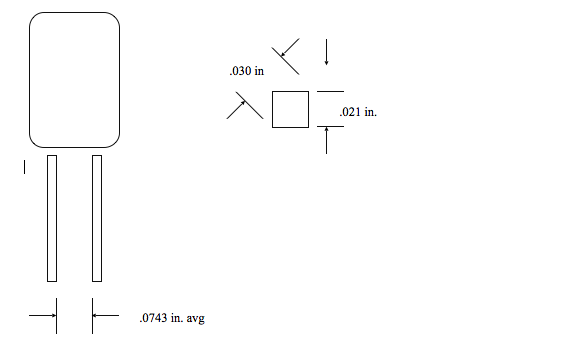
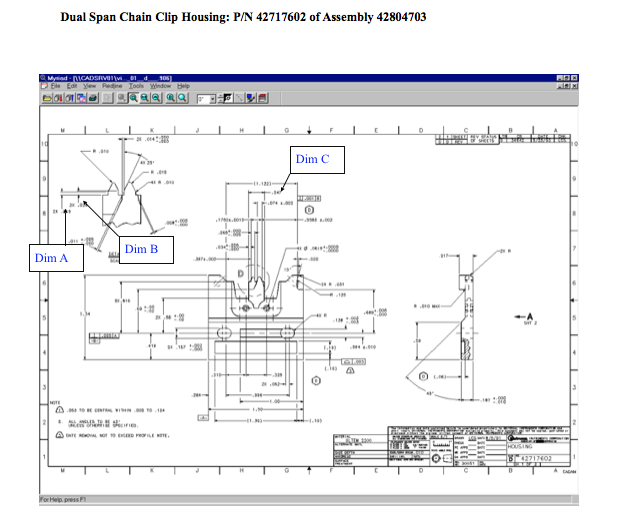
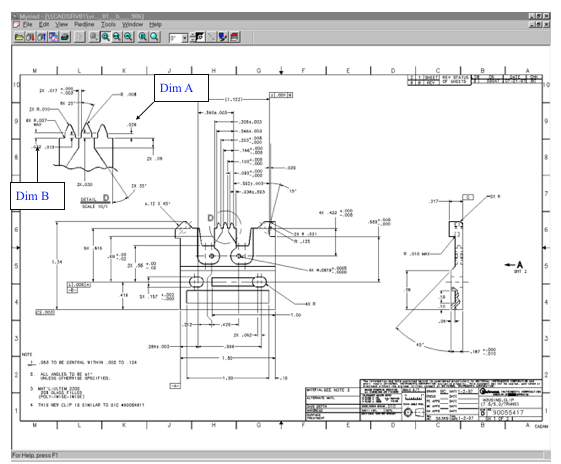
Dimensions A,B and C were identified as critical to function (see Appendix 3 for detail). 2.5mm, steel, .021 in. square, .030 diagonal leaded LED’s were used for the test. These LED’s have an average distance between leads of .0743 in. (See illustration on page 2)
Dual Span Clips:
The clip housing “tooth”, dimension C, is .074 +/-.002 in. Therefore, wear was not observed on the sides of the tooth, but was observed on the corner radii. On the dual clip, a 2.5mm component is engaged by two clamps: the left lead by the full clamp on the left and the right lead by the half clamp on the right.
Triple Span Clips:
Due to the dimensioning scheme of the triple span clip, dimension C is not tooth width, but distance to the side of the tooth as shown, .038 +/-. 003 in. As in the case of the dual span clip, wear was observed on the corner radii. This is a reasonable result since the tooth width is .062 +. 000/-. 005 in. and the average distance between component leads was .0743 in. On the triple clip, a 2.5mm component is engaged only by the left clamp: the left lead by the full clamp and the right lead by the half clamp.
Force and Distance Measurements: See Appendix 2
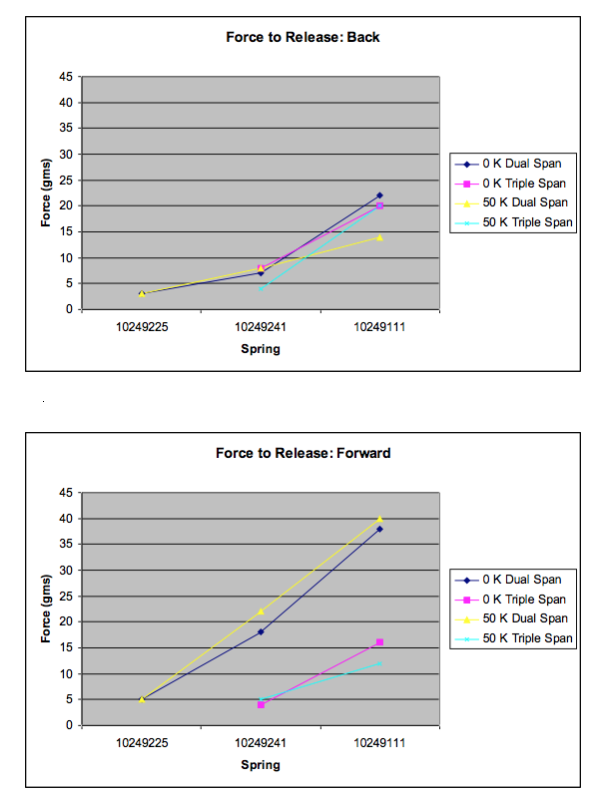
Appendix 2 shows comparison graphs of unused (unworn) clips versus tested (worn) clips and the effect of wear on performance. The clip measurements were taken using a 2.5mm setup tool since 2.5mm components were used for the wear test.
Summary
Assumption: 2.5mm component used for test is a suitable representative to determine chain clip wear.
Dual Span Clips:
Dimension A: spring force is not a significant source of wear.
Dim B and C: spring force is a significant source of wear.
(See Appendix 1 for supporting ANOVA analysis)
Backward ‘force to release’ performance degrades significantly for the dual span test clips with the 10249111 springs. The 10249241 spring performs more consistently between the unworn and worn chain clips.
Distance to release was the same for unworn and test (worn) clips.
Radial 6380A dual span chain clips use the 10249225 spring.
Radial 6380B “XT” dual span chain clips use the 10249241 spring.
Triple Span Clips:
Dimension A and C: spring force is not a significant source of wear.
Dimension B: spring force is a significant source of wear.
(See Appendix 1 for supporting ANOVA analysis)
Forward ‘force to release’ and forward’.050” lean force’ performance is poor for both worn and unworn clips, although the clips with the 10249111 spring performe slightly better in these two categories than the 10249241 spring.
The heavier 10249111 spring performs better overall than the current production 10249241 spring.
Distance to release was the same for unworn and test (worn) clips.
Radial 6380A triple span chain clips use the 10249241 spring.
Radial 6380B “XT” triple span chain clips use the 10249111 spring.
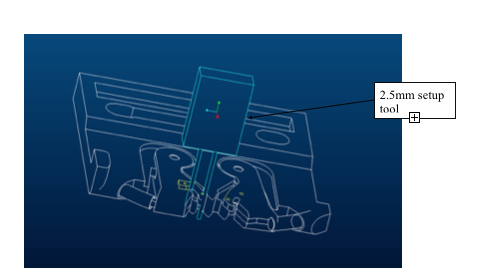
The illustration below shows the setup for a .050” forward lean. The backward .050” lean measurements were set up with the same gap between the test fixture attachment, mounted behind the tool, and the 2.5mm setup tool. The force measurement was taken at the point where the 2.5mm tool touched the test fixture attachment, which was approximately the same height as the tool in the clip.
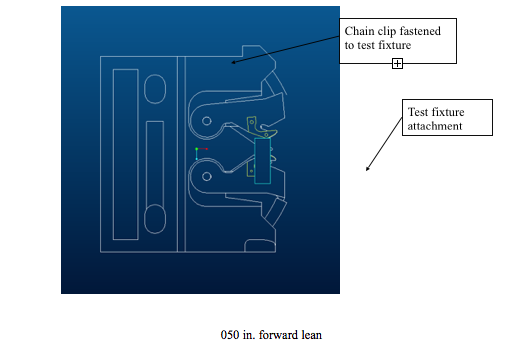
050 in. forward lean
The ‘force to release’ force measurements were taken at the point where the 2.5mm setup tool disengaged from the chain clip clamps with at least one lead.
Conclusion
The data presented here leads to the following conclusions:
- Overall, a higher spring constant results in improved holding ability in both the worn and unworn clips. However, it is nit clear whether wear at 50,000 cycles significantly decreases clip performance. Further testing would be required to determine at what point performance begins to decline.
- The performance of the triple span clip improves with the heavier 10249111 spring, although it is not as dramatic an improvement as the dual span clip with the heavier spring.
Appendix 1
Minitab Analysis of worn clip Data
Descriptive Statistics: DIM A, DIM B, DIM C
Variable N Mean Median TrMean StDev SE Mean
DIM A 30 2.323 1.900 2.200 1.600 0.292
DIM B 30 2.413 2.300 2.335 1.456 0.266
DIM C 30 0.583 0.200 0.504 1.431 0.261
Variable Minimum Maximum Q1 Q3
DIM A 0.000 7.000 1.375 3.300
DIM B 0.000 6.100 1.400 3.250
DIM C -1.700 4.400 -0.425 1.325
The means above reflect 1000 times the change in dimension value.
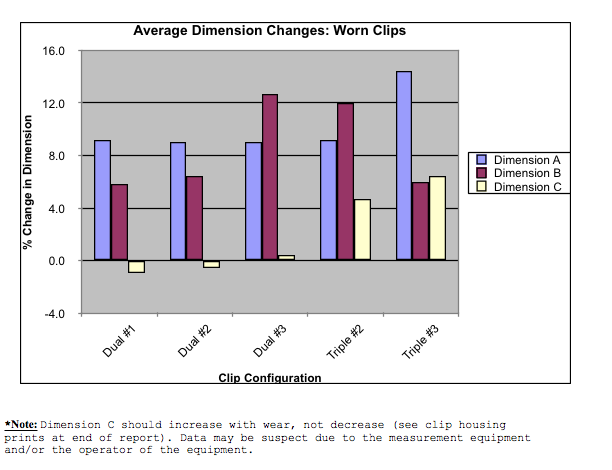
*Note: Dimension C should increase with wear, not decrease (see clip housing prints at end of report). Data may be suspect due to the measurement equipment and/or the operator of the equipment.
One-way ANOVA: DIM A versus NUM COMPONENTS
Analysis of Variance for DIM A
Source DF SS MS F P
NUM COMP 2 2.73 1.36 0.52 0.603
Error 27 71.47 2.65
Total 29 74.19
Individual 95% CIs For Mean
Based on Pooled StDev
Level N Mean StDev ——-+———+———+———
5 20 2.420 1.876 (—–*—–)
10 4 2.700 1.140 (————-*————)
15 6 1.750 0.373 (———–*———-)
——-+———+———+———
Pooled StDev = 1.627 1.2 2.4 3.6
>> P-value greater than .05: Number of new components presented to clip is not significant
One-way ANOVA: DIM B versus NUM COMPONENTS
Analysis of Variance for DIM B
Source DF SS MS F P
NUM COMP 2 7.95 3.97 2.00 0.155
Error 27 53.57 1.98
Total 29 61.51
Individual 95% CIs For Mean
Based on Pooled StDev
Level N Mean StDev ——-+———+———+———
5 20 2.220 1.539 (—–*—-)
10 4 1.875 0.826 (———–*———–)
15 6 3.417 1.141 (——–*———)
——-+———+———+———
Pooled StDev = 1.409 1.2 2.4 3.6
>> P-value greater than .05: Number of new components presented to clip is not significant
One-way ANOVA: DIM C versus NUM COMPONENTS
Analysis of Variance for DIM C
Source DF SS MS F P
NUM COMP 2 0.56 0.28 0.13 0.880
Error 27 58.86 2.18
Total 29 59.42
Individual 95% CIs For Mean
Based on Pooled StDev
Level N Mean StDev ———-+———+———+——
5 20 0.635 1.592 (—–*——)
10 4 0.725 1.825 (————–*————–)
15 6 0.317 0.382 (———–*————)
———-+———+———+——
Pooled StDev = 1.476 0.0 1.0 2.0
>> P-value greater than .05: Number of new components presented to clip is not significant
Descriptive Statistics: COMP SPAN
Variable N Mean Median TrMean StDev SE Mean
COMP SPA 21 74.290 74.400 74.237 1.025 0.224
Variable Minimum Maximum Q1 Q3
COMP SPA 72.300 77.300 73.750 74.700
One-way ANOVA: DIM A: Dual Span Clip vs. Spring
Analysis of Variance for DIM A_1
Source DF SS MS F P
SPRING_1 2 0.01 0.00 0.00 0.997
Error 15 18.40 1.23
Total 17 18.41
Individual 95% CIs For Mean
Based on Pooled StDev
Level N Mean StDev ——–+———+———+——–
1 6 1.717 1.025 (—————*—————)
2 6 1.700 1.579 (—————*—————)
3 6 1.750 0.373 (—————*—————)
——–+———+———+——–
Pooled StDev = 1.108 1.20 1.80 2.40
>> P-value greater than .05: Spring type is not significant to change in Dim A
One-way ANOVA: DIM B: Dual Span Clip vs. Spring
Analysis of Variance for DIM B_1
Source DF SS MS F P
SPRING_1 2 12.91 6.45 4.98 0.022
Error 15 19.42 1.29
Total 17 32.33
Individual 95% CIs For Mean
Based on Pooled StDev
Level N Mean StDev ——+———+———+———+
1 6 1.550 1.111 (——-*——-)
2 6 1.700 1.161 (——-*——-)
3 6 3.417 1.141 (——-*——–)
——+———+———+———+
Pooled StDev = 1.138 1.2 2.4 3.6 4.8
>> P-value less than .05: Spring type is significant to change in Dim B
One-way ANOVA: DIM C: Dual Span Clip vs. Spring
Analysis of Variance for DIM C_1
Source DF SS MS F P
SPRING_1 2 3.274 1.637 4.57 0.028
Error 15 5.368 0.358
Total 17 8.643
Individual 95% CIs For Mean
Based on Pooled StDev
Level N Mean StDev -+———+———+———+—–
1 6 -0.7000 0.5329 (——-*——–)
2 6 -0.4000 0.8025 (——-*——–)
3 6 0.3167 0.3817 (——-*——–)
-+———+———+———+—–
Pooled StDev = 0.5982 -1.20 -0.60 0.00 0.60
>> P-value less than .05: Spring type is significant to change in Dim C
One-way ANOVA: DIM A: Triple Span Clip vs. Spring
Analysis of Variance for DIM A_2
Source DF SS MS F P
SPRING_2 1 6.90 6.90 2.12 0.176
Error 10 32.62 3.26
Total 11 39.52
Individual 95% CIs For Mean
Based on Pooled StDev
Level N Mean StDev —–+———+———+———+-
2.5-2 6 2.467 1.338 (———-*———-)
2.5-3 6 3.983 2.176 (———-*———-)
—–+———+———+———+-
Pooled StDev = 1.806 1.5 3.0 4.5 6.0
>> P-value greater than .05: Spring type is not significant to change in Dim A
One-way ANOVA: DIM B: Triple Span vs. Spring
Analysis of Variance for DIM B_2
Source DF SS MS F P
SPRING_2 1 10.08 10.08 5.78 0.037
Error 10 17.46 1.75
Total 11 27.54
Individual 95% CIs For Mean
Based on Pooled StDev
Level N Mean StDev ——+———+———+———+
2.5-2 6 3.617 1.680 (———*———)
2.5-3 6 1.783 0.818 (———*———)
——+———+———+———+
Pooled StDev = 1.321 1.2 2.4 3.6 4.8
>> P-value less than .05: Spring type is significant to change in Dim B
One-way ANOVA: DIM C:Triple Span vs. Spring
Analysis of Variance for DIM C_2
Source DF SS MS F P
SPRING_2 1 0.85 0.85 0.48 0.505
Error 10 17.84 1.78
Total 11 18.69
Individual 95% Cis For Mean
Based on Pooled StDev
Level N Mean StDev ——-+———+———+———
2.5-2 6 1.583 1.150 (———–*———–)
2.5-3 6 2.117 1.499 (———–*———–)
——-+———+———+———
Pooled StDev = 1.336 1.0 2.0 3.0
>> P-value greater than .05: Spring type is not significant to change in Dim C
Appendix 2
Appendix
Dual Span Chain Clip Housing: P/N 42717602 of Assembly 42804703
Triple Span Clip Housing: P/N 90055417 of Assembly 90055421
Procedure for Measuring the Airflow of the Auto Insertion machine (VCD-Seq. 8.)
This procedure documents the method and apparatus for measuring the average air consumption and the peak air flow for the VCD-Seq. 8.
Apparatus:
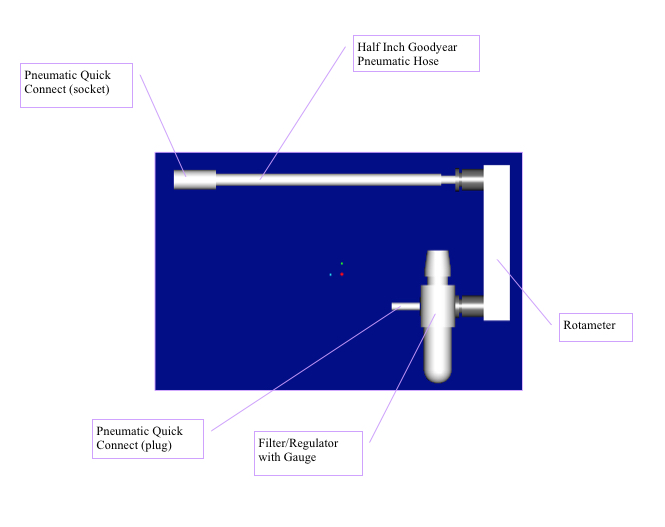
A Dwyer Rotameter (S/N 00006405) was used to measure the flow. As shown below, the flow meter had a number of pneumatic components on it to allow for connecting to the machine and regulating the pressure. The particular filter/regulator used is a Wilkerson CB6-03-000B J95 with a 0-160 psi gauge marked “Not for Verification.”
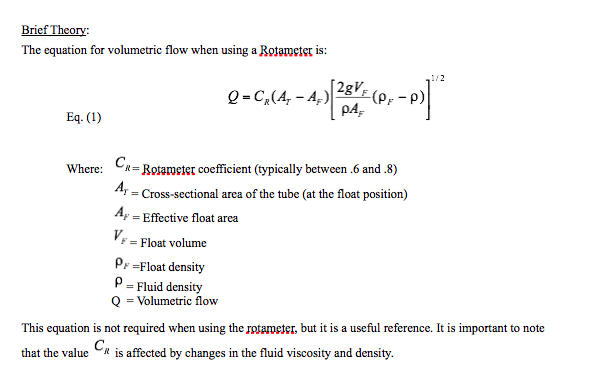
Brie
f
Rotameter Diagram:
SCFM Scale:
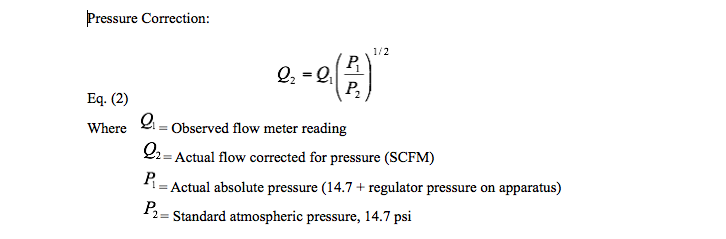
The scale of the Rotameter is valid at atmospheric conditions only. For our purposes we will neglect any variations in the temperature or the specific gravity of the actual air that we use. We will only concern ourselves with the pressure variations.
Pressure Correction:
Eq. (2)
Where = Observed flow meter reading
= Actual flow corrected for pressure (SCFM)
= Actual absolute pressure (14.7 + regulator pressure on apparatus)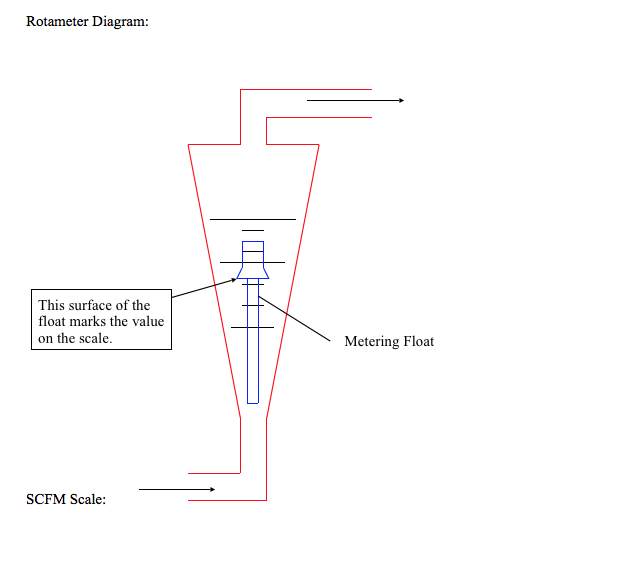
= Standard atmospheric pressure, 14.7 psi
Measurement Procedure:
The flow meter is to be connected to the machine in an inline fashion at the air input quick connect. The air drop is connected to the flow meter and the flow meter is then connected to the machine (actual order does not matter). For the readings to be accurate the flow meter must be held vertical and the pressure must be set as precisely as possible. The pressure should be set at 90 psi, unless the input pressure can not support this. In this case use a pressure above 80 psi with a corresponding gauge marking for accuracy. This pressure should be noted when recording measurements.
The machine should be loaded with a typical quality pattern and zeroed. While one person holds and watches the flow meter, the other person starts the machine. Peak flow is the maximum reading the flow meter obtains while the measurements are being taken. The peak flow can occur at the start of the machine or board, or in the middle of a run. So it is important to watch the meter at all times. The dynamics of the meter are not taken into account for these readings. So the actual peak flow may be slightly lower than the value on the meter. As the machine runs, the flow constantly fluctuates. Besides occasional spikes, the readings will typically fall between two measured values. These values give us the “Typical High” and “Typical Low” readings. The machine should run at least one board or window when performing the measurements. Also as many machines as possible should be measured.
Once the data is taken, these flow values read off the meter need to be converted to the actual flow in SCFM using the pressure correction factor shown above. Once all of the data is converted into SCFM the peak flow values need to be converted into CFM @ 90 psi. We can accomplish this conversion through the following:
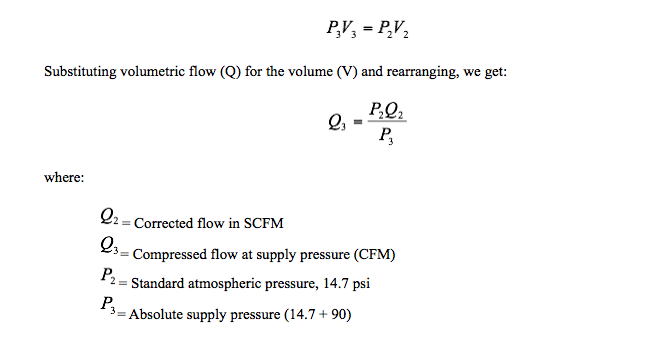
When multiple machines are measured, the peak flow is the highest value of all of the machines. The average consumption is found by averaging all of the typical high’s and low’s.
For the VCD/Seq. 8 machine, the inserter and the sequencer were measured together initially. Then the inserter was measured in dry cycle with the sequencer portion of the machine off. The two sets of values were subtracted to determine the consumption and flow of the sequencer alone. It is important to note that adding the second sequencer drop to the machine does not change the machine consumption rate.
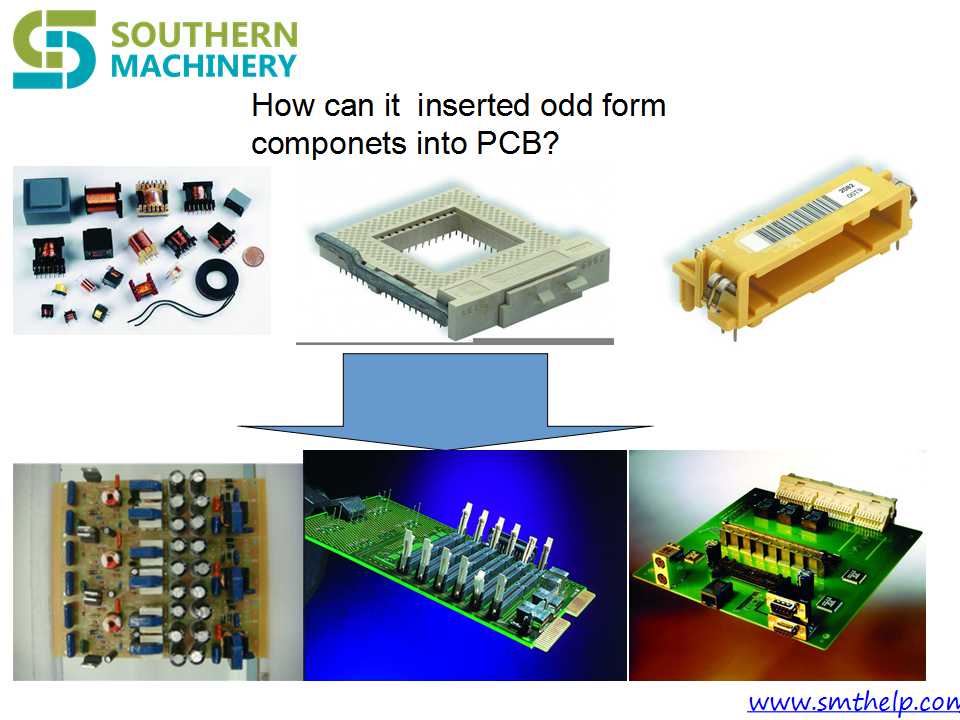
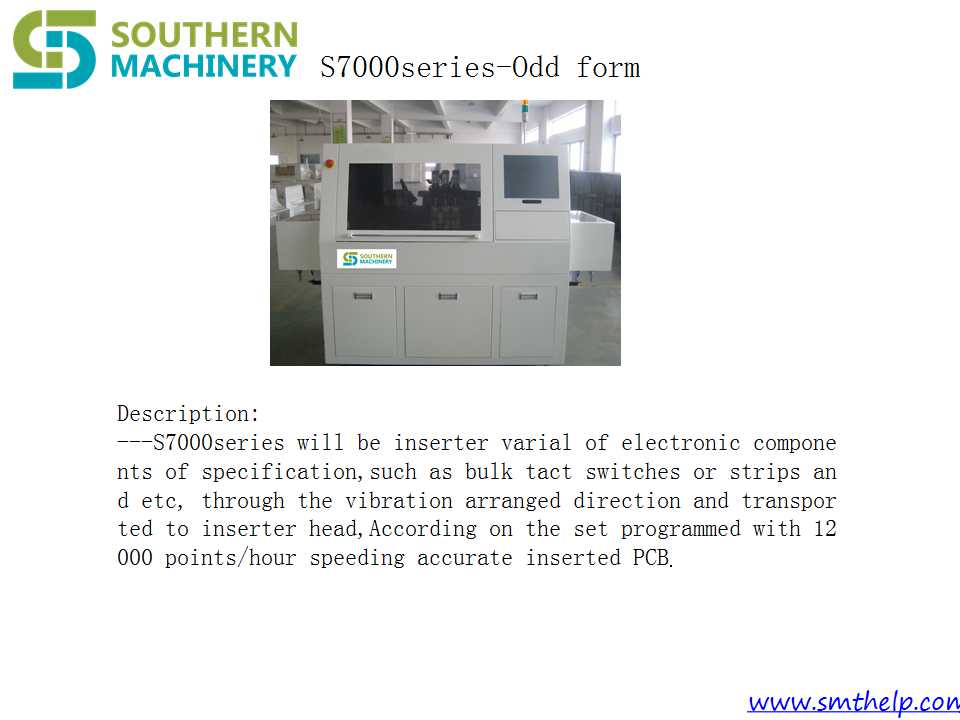
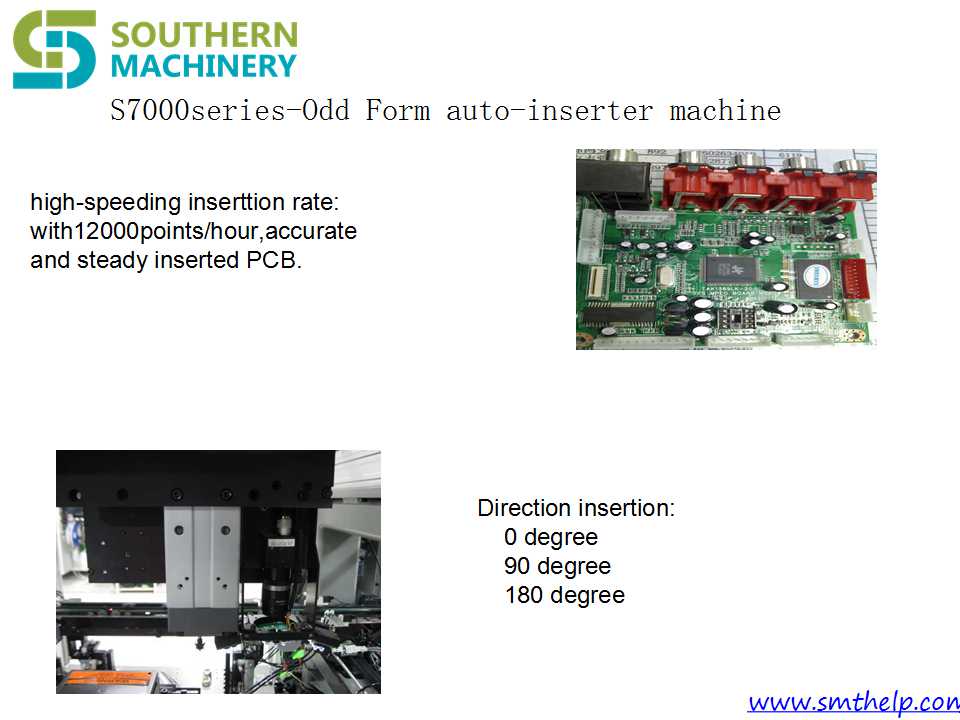
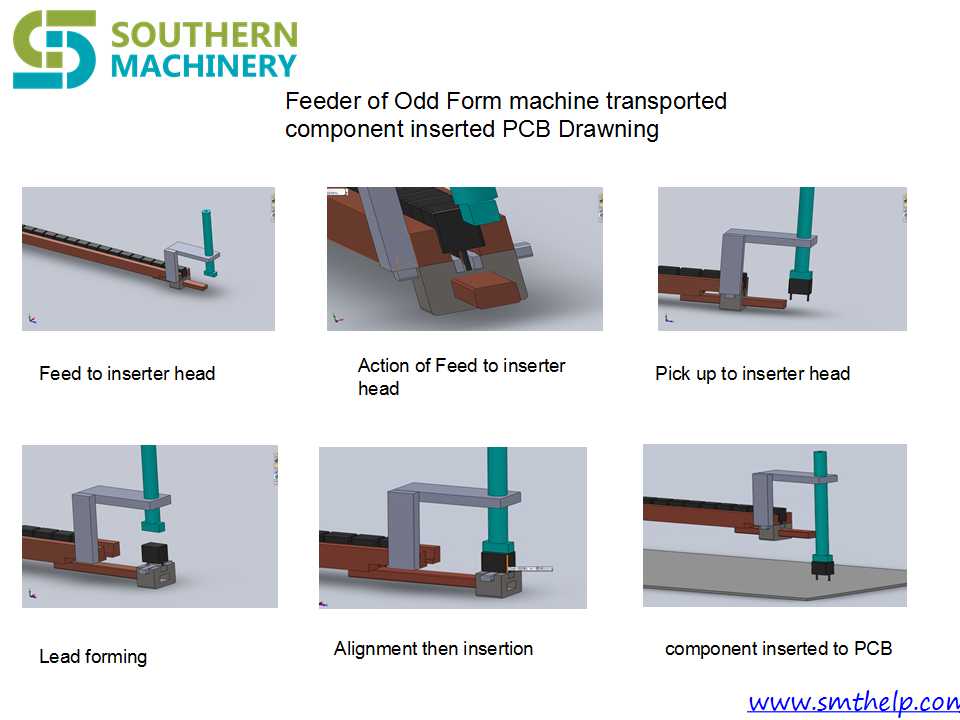
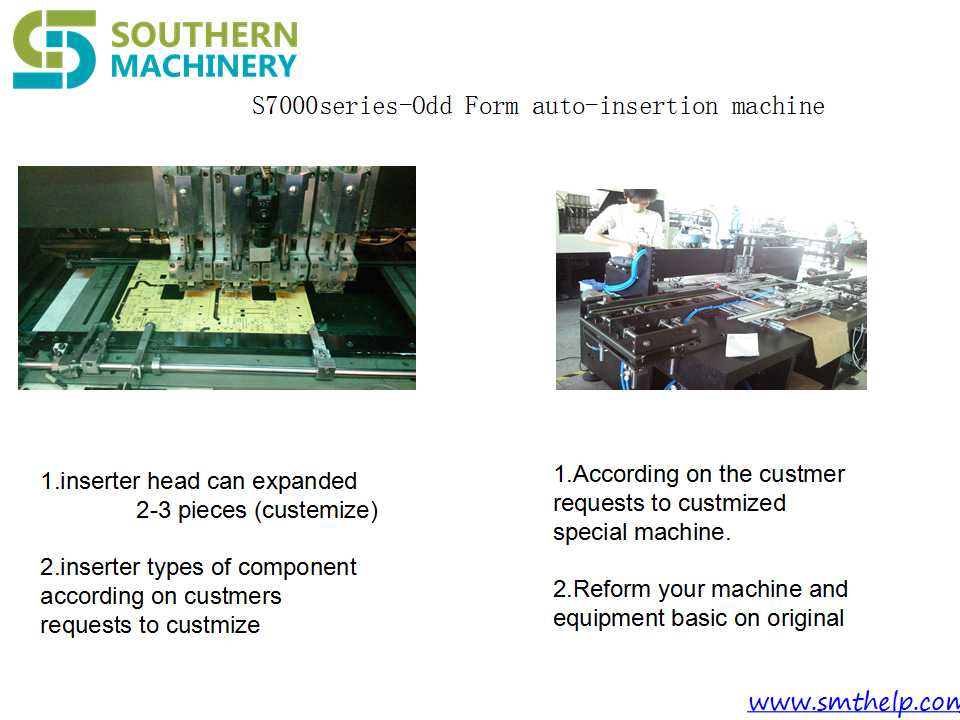
solution for odd form
solution for SMT&AI,and more information contacting info@smthelp.net
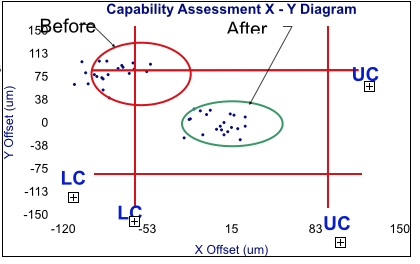
SMT Equipment Capability –CPK
Capability analysis measures equipment performance against desired specification
The analysis output plots measured results
Machines can then be optimized based on measured accuracy performance
SMEMA: What is it?
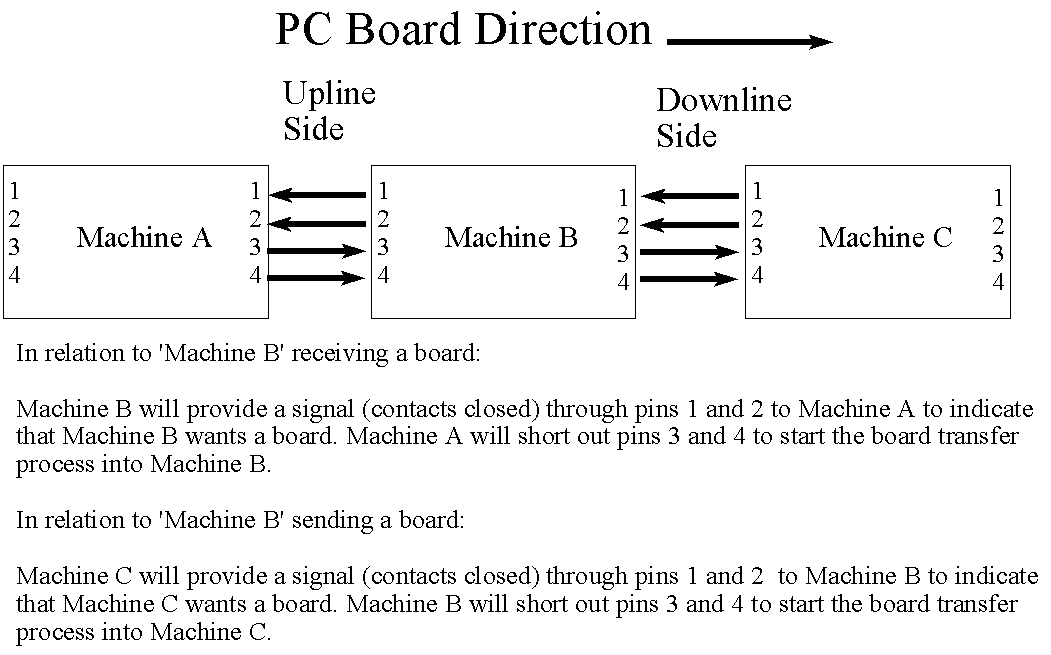
In the surface mount electronics industry, manufacturing each type of product requires a variety of process steps, and therefore a multitude of process equipment. This production equipment varies greatly not only from manufacturer to manufacturer, but also in its function. However, the different equipment must be able to work together to produce the final goods. Difficulties arise when equipment is not standardized and cannot communicate. To help cross these barriers, the Surface Mount Equipment Manufacturers Association (SMEMA) was formed. SMEMA is a nonprofit organization composed of manufacturers of equipment or software used for surface mount board production. In this article we will give a brief overview of SMEMA and define the mechanical and electrical interface standard implemented on equipment manufactured
SMEMA’s objectives ·
promote standards for the interface and operation of production equipment · assure users that equipment adhering to SMEMA standards interfaces easily · advance surface mount technology and promote its uses · investigate http://modafinil200mg.net areas where the association can benefit member companies
Interface standard
The mechanical and electrical interface standard provides an equipment specification for single board transfer systems of surface-mounted PCBs. The standard defines the electrical and mechanical concepts of the machine interface. The latest SMEMA-published standard is version 1.2. This article will highlight the SMEMA electrical interface. A mechanical interface overview will appear in a future issue of Product Perspective.
Signal overview, descriptions, and timing
The following diagrams provide a simplified explanation of the electrical signals and their locations, timing, and terminology. The diagrams refer to conveyor-type products, but the concepts are the same for any SMEMA interface. Please note that these drawings are not the actual SMEMA specification, but are simplified interpretations to help you understand the interface. The actual SMEMA specification is more specific; details on how to obtain this specification are provided at the end of this article.